Louisville Housing Market Report - September 2026
Louisville market report - built from Louisville MLS data by Winner Realty
Louisville home prices held roughly flat over the past year while the number of homes for sale jumped by nearly a third. Here is what August 2026's MLS numbers say for buyers, sellers, and investors — city-wide and by neighborhood.
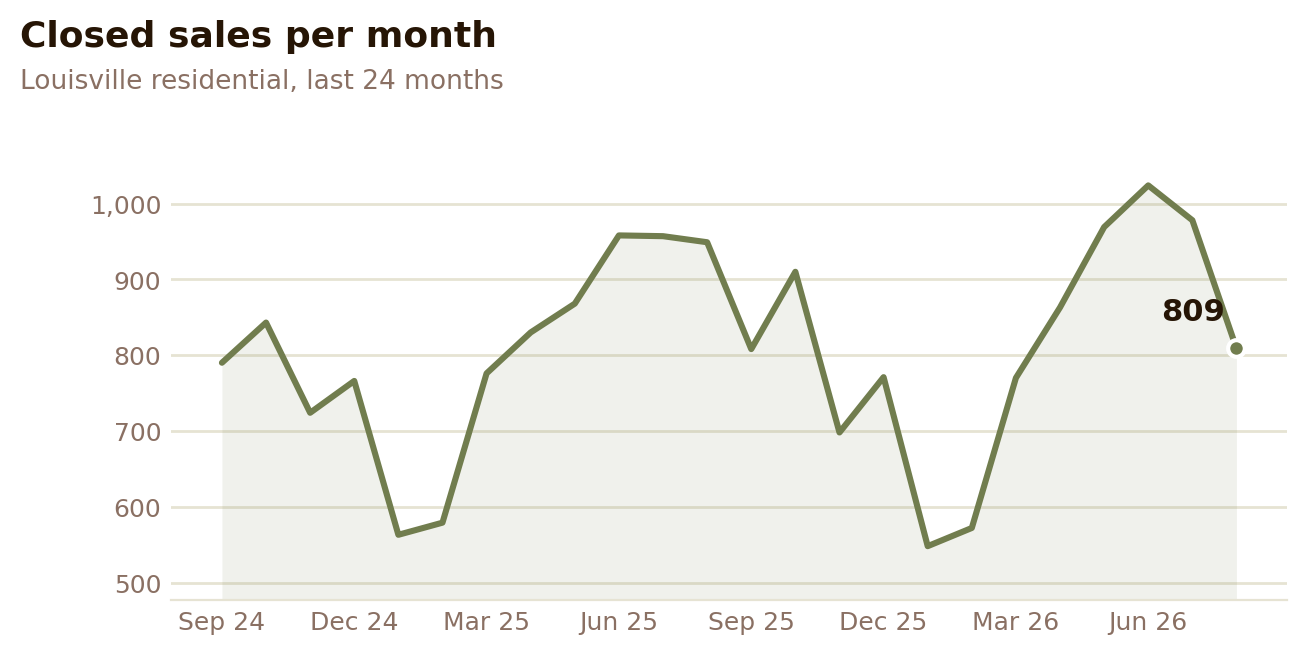
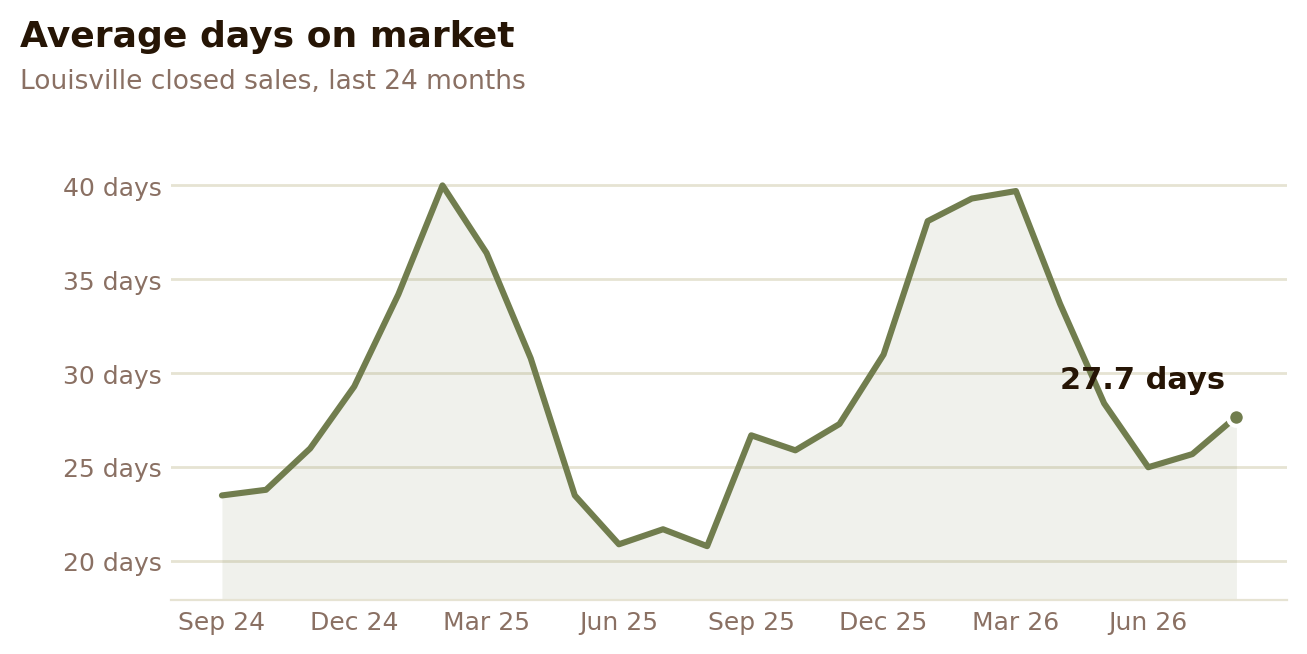
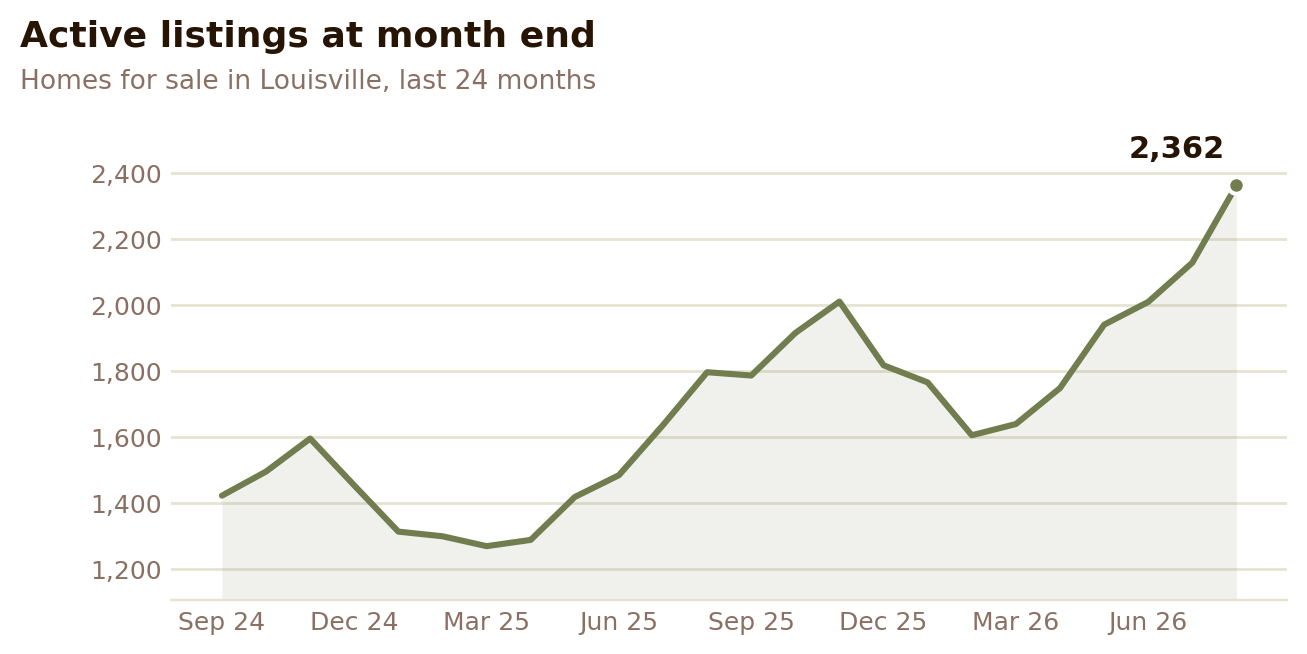
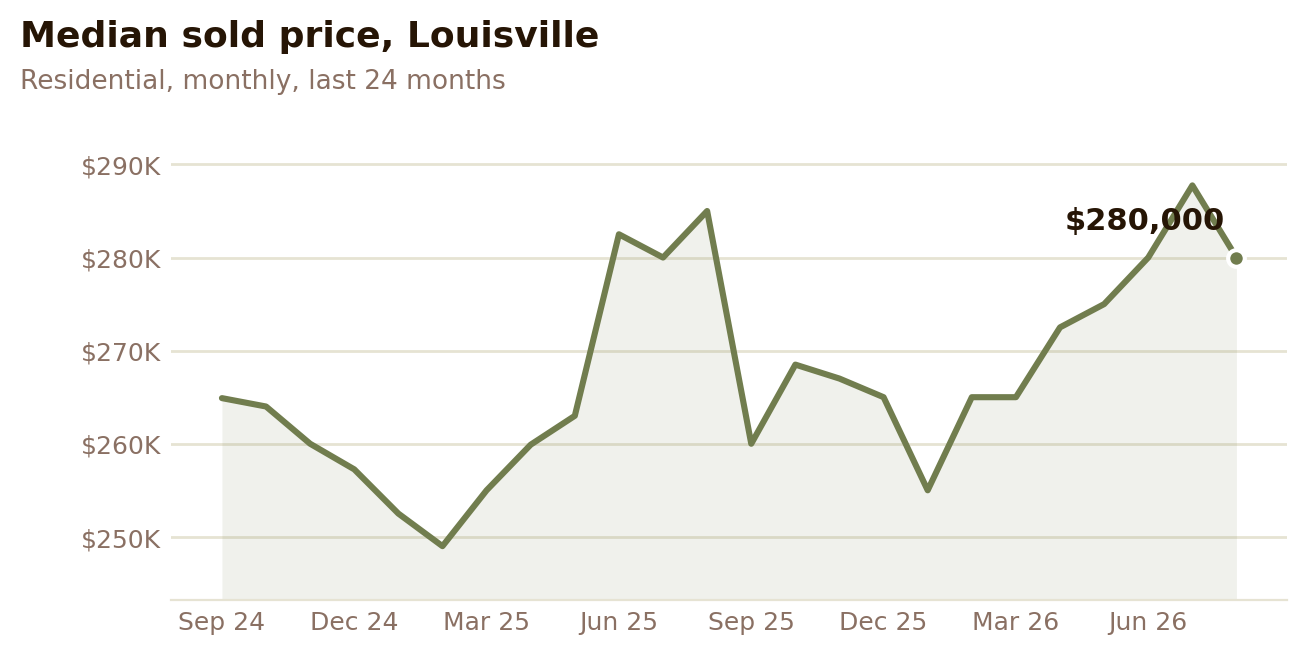
Median sold price: $280,000 (-1.8% year over year). Active listings: 2,362 (+32% YoY). Average days on market: 28 days. Months of supply: 2.9 (a seller's market, but far less lopsided than a year ago). Sale-to-list price: 98.8%. Closed sales: 809/month, $274,951,650 in sales volume.
The Louisville residential market has shifted from tight to balanced over twelve months, and it did it without a price drop. The median sold price in August 2026 was $280,000, essentially unchanged from $285,000 in August 2025, and the average sold price actually rose to $339,866 (+2.9%), a sign that the upper end of the market is still moving.
What changed is supply. Louisville ended August 2026 with 2,362 active listings, up 32% from 1,796 a year earlier and the highest month-end count in the two years of data we track. New listings kept coming (1,338 in August, +2.8% year over year) while closed sales slipped to 809 from 949. Year to date, though, closings are flat (6,533 through August versus 6,480 in 2025), so this is inventory catching up with demand rather than demand disappearing.
Your competition has grown by roughly a third, and buyers can afford to wait a few extra weeks. The two levers that matter most right now are launch price and presentation. In August 2026, Louisville sellers who priced to the market closed within about four weeks at nearly 99% of list; sellers who started high gave back nearly three points on average before finding their buyer. A strong pre-listing valuation, professional photography, and an aggressive first two weeks are worth more today than they were in 2025.

Median sold price, active listings, average days on market, and closed sales for Louisville.
Louisville (all) — median $280,000 | 2,362 active | 2,811 sold (3-mo) | 26 days on market | 98.8% sale-to-list | 2.5 months supply | +32.3% inventory YoY
Clifton / Crescent Hill / St. Matthews — median $385,000 | 187 active | 238 sold (3-mo) | 20 days on market | 99.0% sale-to-list | 2.4 months supply | +48.4% inventory YoY
Prospect — median $762,500 | 140 active | 135 sold (3-mo) | 38 days on market | 98.1% sale-to-list | 3.1 months supply | +12.0% inventory YoY
Jeffersontown — median $309,000 | 40 active | 50 sold (3-mo) | 16 days on market | 98.9% sale-to-list | 2.4 months supply | +233.3% inventory YoY
Downtown / Old Louisville / Shively / West Louisville — median $155,000 | 440 active | 244 sold (3-mo) | 43 days on market | 95.8% sale-to-list | 5.4 months supply | +39.2% inventory YoY
Jeffersontown and Prospect reflect listings whose MLS city field is set to that city; homes in those areas entered under "Louisville" are counted in the city-wide line. St. Matthews and Crescent Hill share MLS Area 03 with Clifton. Jeffersontown's year-over-year inventory swing looks dramatic (+233%) but is off a small base (12 to 40 active listings) — read it as noisy, not as a trend.

-
Is Louisville a buyer's or seller's market right now?By the numbers, August 2026 Louisville sits at about 2.9 months of supply, up from 1.9 a year earlier. Under three months is generally considered a seller's market and three to six balanced, so Louisville is a seller's market, but a far less lops...
-
What is the median home price in Louisville, KY?The median sold price for a residential home in Louisville was $280,000 in August 2026, compared with $285,000 in August 2025 (-1.8%). The average sold price was $339,866.
-
How long does it take to sell a house in Louisville?Closed sales in August 2026 averaged 28 days on market, versus 21 days a year earlier. Homes that were priced correctly from day one still moved quickly; the gap between the sale-to-original-list ratio (97.3%) and the sale-to-final-list ratio (98.8%) shows...
-
How many homes are for sale in Louisville?There were 2,362 active residential listings in Louisville at the end of August 2026, up +32% from 1,796 a year earlier and the highest month-end total in the last two years.